
Page 146 - 磁共振成像2024年7期电子刊
P. 146
磁共振成像 2024年7月第15卷第7期 Chin J Magn Reson Imaging, Jul, 2024, Vol. 15, No. 7 临床研究||Clinical Articles
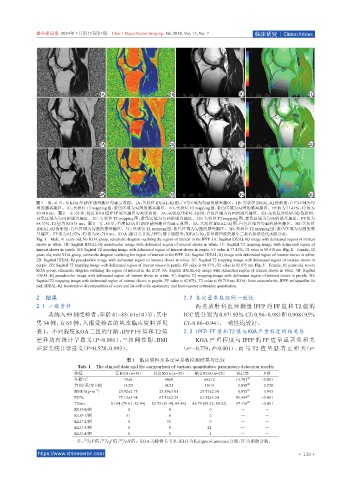
图 1 男,41岁,无 KOA组 IPFP感兴趣区勾画示意图。1A:矢状位 IDEAL-IQ图,白色区域为勾画的感兴趣区。1B:矢状位 IDEAL-IQ伪彩图,白色区域为勾
画的感兴趣区。1C:矢状位 T2 mapping 图,紫色区域为勾画的感兴趣区。1D:矢状位 T2 mapping 图,紫色区域为勾画的感兴趣区。FF 值为 77.41%,T2 值为
80.910 ms。图 2 女,62岁,轻度 KOA组 IPFP感兴趣区勾画示意图。2A:矢状位 IDEAL-IQ图,白色区域为勾画的感兴趣区。2B:矢状位 IDEAL-IQ伪彩图,
白色区域为勾画的感兴趣区。2C:矢状位 T2 mapping 图,紫色区域为勾画的感兴趣区。2D:矢状位 T2 mapping 图,紫色区域为勾画的感兴趣区。FF 值为
68.37%,T2 值为 82.875 ms。图 3 女,85 岁,重度 KOA 组 IPFP 感兴趣区勾画示意图。3A:矢状位 IDEAL-IQ 图,白色区域为勾画的感兴趣区。3B:矢状位
IDEAL-IQ 伪彩图,白色区域为勾画的感兴趣区。3C:矢状位 T2 mapping 图,紫色区域为勾画的感兴趣区。3D:矢状位 T2 mapping 图,紫色区域为勾画的感
兴趣区。FF值为62.07%,T2值为90.710 ms。KOA:膝骨关节炎;IPFP:髌下脂肪垫;IDEAL-IQ:非对称回波的最小二乘估算法迭代水脂分离。
Fig. 1 Male, 41 years old, No KOA group, schematic diagram outlining the region of interest in the IPFP. 1A: Sagittal IDEAL-IQ image with delineated region of interest
shows in white. 1B: Sagittal IDEAL-IQ pseudocolor image with delineated region of interest shows in white. 1C: Sagittal T2 mapping image with delineated region of
interest shows in purple. 1D: Sagittal T2 mapping image with delineated region of interest shows in purple. FF value is 77.41%, T2 value is 80.910 ms. Fig. 2 Female, 62
years old, mild KOA group, schematic diagram outlining the region of interest in the IPFP. 2A: Sagittal IDEAL-IQ image with delineated region of interest shows in white.
2B: Sagittal IDEAL-IQ pseudocolor image with delineated region of interest shows in white. 2C: Sagittal T2 mapping image with delineated region of interest shows in
purple. 2D: Sagittal T2 mapping image with delineated region of interest shows in purple. FF value is 68.37%, T2 value is 82.875 ms. Fig. 3 Female, 85 years old, severe
KOA group, schematic diagram outlining the region of interest in the IPFP. 3A: Sagittal IDEAL-IQ image with delineated region of interest shows in white. 3B: Sagittal
IDEAL-IQ pseudocolor image with delineated region of interest shows in white. 3C: Sagittal T2 mapping image with delineated region of interest shows in purple. 3D:
Sagittal T2 mapping image with delineated region of interest shows in purple. FF value is 62.07%, T2 value is 90.710 ms. KOA: knee osteoarthritis; IPFP: infrapatellar fat
pad; IDEAL-IQ: iteraterative decomposition of water and fat with echo asymmetry and least-squares estimation quantitation.
2 结果 2.2 各定量参数组间一致性
2.1 一般资料 两名放射科医师测量 IPFP 的 FF 值和 T2 值的
共纳入99例受检者,年龄41~85(61±10)岁,其中 ICC 值分别为 0.97(95% CI:0.96~0.98)和 0.908(95%
男 34 例,女 65 例,入组受检者的基本临床资料详见 CI:0.86~0.94),一致性均较好。
表 1。不同程度 KOA三组的年龄、IPFP FF值和 T2值 2.3 IPFP FF值和T2值与KOA严重程度的相关性
差异均有统计学意义(P<0.001),三组间性别、BMI KOA 严重程度与 IPFP 的 FF 值呈显著负相关
差异无统计学意义(P=0.578、0.993)。 (r= −0.779,P<0.001),而 与 T2 值 呈 显 著 正 相 关(r=
表1 临床资料及各定量参数检测结果与比较
Tab. 1 The clinical data and the comparison of various quantitative parameters detection results
特征 无KOA(n=39) 轻度KOA(n=35) 重度KOA(n=25) 统计量 P值
年龄/岁 55±8 64±8 66±10 15.703 ① <0.001
性别(男/女)/例 14/25 10/25 10/15 1.098 ② 0.578
−2
BMI/(kg•m ) 25.92±2.75 25.89±3.05 25.97±2.30 0.070 ① 0.993
FF/% 73.13±3.98 67.42±2.25 61.92±3.24 91.454 ① <0.001
T2/ms 81.04 (79.61, 82.44) 82.72 (81.44, 84.46) 86.79 (85.32, 89.12) 47.116 ③ <0.001
KLG-0/例 8 0 0 — —
KLG-1/例 31 0 0 — —
KLG-2/例 0 35 0 — —
KLG-3/例 0 0 21 — —
KLG-4/例 0 0 4 — —
2
③
②
注:为F值;为χ 值;为H值。KOA为膝骨关节炎;KLG为Kellgren-Lawrence分级;FF为脂肪分数。
①
https://www.chinesemri.com ·139 ·